- Abstract
- Introduction
- Physical and chemical properties
- Search strategy
- Analytical method
- High-performance liquid chromatography
- High performance thin-layer chromatography
- UV spectroscopic method
- Ultra-performance liquid chromatography
- LC-MS/MS (Liquid chromatography – mass spectroscopy)
- Method benefits and limitations
- Critical comparison of analytical methods
- Conclusion
- Acknowledgement
- Funding
- Availability Statement
- AI Use Disclosure Statement
- Authors Contributions
- Conflict of Interests
- References

Int J Chem Res, Vol 10, Issue 4, 1-10Review Article
Analytical Method Development Strategies for Metformin in Combined Drug Formulations: A Review
MANJIRI M. SHASTRI*, RAJENDRA B. PATIL, ARADHANA DESHMUKH
Pharmaceutical Chemistry Department, JSPM’s Rajarshi Shahu College of Pharmacy and Research, Tathawade, Pune-411033, Maharashtra, India
*Corresponding author: Manjiri M. Shastri; *Email: [email protected]
Received: 28 Apr 2026 Revised and Accepted: 30 Jun 2026
Abstract
Metformin is a widely used oral antihyperglycemic agent and a first-line therapy for the management of type 2 diabetes mellitus, particularly in patients with obesity. Owing to its extensive clinical use, the development of reliable analytical methods for its quantification in bulk drugs, pharmaceutical formulations, and biological matrices is essential. This review compiles and critically evaluates various analytical techniques reported for the estimation of metformin, both as a single drug and in combination with other antidiabetic agents. The discussed methods include high-performance liquid chromatography (HPLC), ultra-performance liquid chromatography (UPLC), high-performance thin-layer chromatography (HPTLC), UV–visible spectrophotometry, and liquid chromatography–tandem mass spectrometry (LC–MS/MS). Among these, HPLC and LC–MS/MS methods are most widely employed due to their high sensitivity, specificity, and reproducibility. This review aims to assist researchers in selecting appropriate analytical techniques and highlights the need for developing cost-effective, rapid, and environmentally sustainable methods.
Keywords: Analytical methods, Metformin, HPLC, Chromatography, Combination drugs, Method validation
© 2026 The Authors.Published by Innovare Academic Sciences Pvt Ltd. This is an open access article under the CC BY license (http://creativecommons.org/licenses/by/4.0/)
DOI: http://dx.doi.org/10.22159/ijcr.2026v10i4.347 Journal homepage: https://ijcr.info/index.php/journal
Introduction
Metformin hydrochloride, the hydrochloride salt of N,N-dimethylimidodicarbonimidic diamide, is an antihyperglycemic agent that generally does not produce hypoglycemia under normal therapeutic conditions. Biguanides reduce hepatic glucose production and improve peripheral insulin sensitivity, particularly in skeletal muscle tissue, thereby enhancing glucose utilization and glycemic control [1–15]. Several previously reported analytical methods are time-consuming, costly, and technically complex. In addition, some methods utilize expensive and hazardous mobile phases that may reduce column efficiency and shorten column lifespan. Therefore, the present method was designed to provide a simple, rapid, sensitive, and economical approach for the determination of metformin in bulk drug substances and pharmaceutical dosage forms. Metformin is the most widely used oral biguanide for the management of type 2 diabetes mellitus. Its antihyperglycemic activity is primarily mediated through reduction of hepatic gluconeogenesis and improvement of peripheral glucose uptake. These effects are associated with activation of liver kinase B1 (LKB1), which subsequently activates adenosine monophosphate-activated protein kinase (AMPK). Activation of AMPK suppresses hepatic glucose production by regulating transcriptional coactivators such as transducer of regulated CREB protein 2 (TORC2). In addition, inhibition of mitochondrial respiration has been proposed as another mechanism contributing to reduced gluconeogenesis by decreasing intracellular energy availability within hepatocytes [1]. The increasing global prevalence of type 2 diabetes mellitus is strongly associated with obesity, sedentary lifestyle, and western dietary habits. Owing to the clinical importance of metformin in antidiabetic therapy, numerous analytical methods have been reported for its quantitative estimation alone or in combination with other drugs. This review summarizes and critically evaluates the analytical techniques reported for metformin and its pharmaceutical combinations, with emphasis on method validation parameters and their pharmaceutical applications.
Physical and chemical properties
The drug metformin is white and almost white crystalline powder, metformin diluted in water with IUPAC name: 3-(diamino methylidene)-1,1-dimethylguanidine, molecular formula C4H11N5 with molecular weight: 129.197 g/mol, melting point; 223–226◦C (decomposes), it is soluble freely as HCl salt in water, stable under recommended storage conditions. Hazardous decomposition products are formed under fire conditions. Metformin exhibits a pKa value of approximately 12.4, indicating its strong basic nature. It is highly hydrophilic with a log P value of −1.43, reflecting poor lipid solubility. The drug shows high aqueous solubility, which is pH-dependent, with increased solubility under acidic conditions due to protonation. These physicochemical properties significantly influence its chromatographic behaviour and method development. [2] fig. 1 shows the structure of metformin hydrochloride.
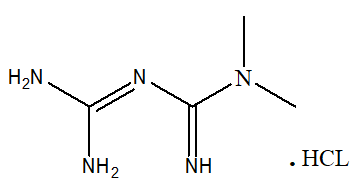
Fig. 1: Chemical structure of metformin hydrochloride (Created by authors using ChemDraw).
Search strategy
A thorough literature search was conducted using PubMed, ScienceDirect, Google Scholar, and SpringerLink. The search was performed with the terms "metformin," "analytical methods," "HPLC," "UPLC," "HPTLC," "LC–MS/MS," and "method validation." The years 2006 to 2025 were considered in the publication dates. It included original, peer-reviewed articles published in English, focusing on validated analytical methods for metformin, either alone or in combination with other drugs. Excluded were review articles, duplicate studies, and those works for which there was an inadequate description of the methodology used. Duplicate records identified during the literature search were screened and removed before inclusion in the review. Reference lists were manually verified to avoid duplicate citation of the same source.
Analytical method
Due to its medical relevance, the development of analytical methods that can accurately quantify metformin or its formulations has been an important aspect in pharmaceutical research. Method development is essential in establishing quantitation and stability studies, as well as quality control of the substance which guarantees the efficacy and safety in the application thereof. There have been numerous studies using various techniques in the development of methods for metformin quantitation in the past two decades, particularly from 2006 to 2025. The different techniques used range from spectrophotometric techniques, chromatographic methods (such as HPLC, UPLC and LC-MS/MS), and hyphenated techniques, among others. In the process, there has been an improvement in analytical science as well as a demonstration of the need for optimizing the methods due to the existing problems of interference, sensitivity, and regulatory aspects. This review aims to combine and critically evaluate the diverse methodologies developed during this period, emphasizing their significance in pharmaceutical analysis and their role in ensuring the consistent quality of metformin-based therapies.
High-performance liquid chromatography
Bhoomaiah B. et al. published an RP-HPLC method for the simultaneous determination of metformin and Miglitol in bulk drugs and combined dosage forms, which was demonstrated to be fast, accurate, reproducible, and straightforward. Chromatographic separation was attempted using a Kromasil C18 column (4.6 mm × 150 mm, 5 μm). Isocratic mobile phase consisted of 60% phosphate buffer (pH adjusted to 5.3 by potassium hydroxide) and 40% methanol flowing at 0.9 ml/min. UV detection was performed at 238 nm. Retention times of metformin and Miglitol were found to be 3.86 min and 7.56 min, respectively, indicating separation in a short period of time. Linearity was verified within a range of 200-500 μg/ml for metformin and 20-50 μg/ml for Miglitol. Percent recoveries of metformin (98.12%-101.53%) and Miglitol (98.06%-101.80%) indicated good accuracy of the method. Validation was performed according to ICH criteria, with the conclusion that the method is precise, specific, and reproducible. This RP-HPLC method will be utilized for routine quantitative evaluation and validation of the stability of both metformin and Miglitol, when these drugs are available in bulk and/or combined dosage forms [3].
Khagga Bhavyasri et al. created a low-cost, easy-to-use, accurate, dependable and reproducible reverse-phase high-performance liquid chromatographic (RP-HPLC) method to simultaneously determine dapagliflozin (DGL) and metformin HCl (MFH) in bulk drug and through various combination tablet dosage forms. The two drugs were separated on a Phenomenex C18 column (250 mm x 4.6 mm) in the mobile phase of Water: Methanol (50:50) and a flow rate of 1.0 ml/min and detected at 230 nm with a column temperature of 30 °C. The method had linearity for MFH over the concentration range of 2-7 µg/ml and for DGL over 60-210 µg/ml, with both having correlation coefficients (r-squared) = 0.999. The precision of the method was determined to be 0.6342% for MFH and 0.8214% for DGL. The method provides estimated limits of detection (LOD) and limit of quantification (LOQ) as 263,000 ppb and 324,000 ppb, respectively, for MFH and 345,000 ppb and 415,000 ppb, respectively, for DGL. The assay of randomly chosen commercial products containing MFH = 99.85% and DGL = 99.73% confirmed the accuracy, reliability, and reproducibility of this analytical method for use in routine quality control assessment of combination dosage forms. The original publication was re-examined and the reported linearity ranges were confirmed as 2–7 µg/ml for metformin hydrochloride and 60–210 µg/ml for dapagliflozin. Although these ranges appear atypical compared with many reported methods, they are reproduced exactly as described in the source article [4].
Akteruzzaman M. et al. developed and validated a simple, efficient, precise, and accurate reverse-phase high-performance liquid chromatographic (RP-HPLC) method for the simultaneous estimation of metformin hydrochloride and rosiglitazone in combined tablet dosage forms. The objective of this study was to develop and validate a rapid, easy-to-use, reliable, and accurate RP-HPLC procedure for the simultaneous quantification of metformin and rosiglitazone in combined tablet form. The chromatographic separation was performed on a C18 bonded silica (ODS) column measuring 250 × 4.6 mm with a particle size of 5 μm. The mobile phase comprised a 60:40 (v/v) mixture of sodium dihydrogen phosphate buffer (pH 3.5) and acetonitrile, and the flow rate was 0.7 ml/min. The respective retention times were 3.35 min for metformin and 11.95 min for rosiglitazone. The reported linearity range for both analytes was 0.03125–0.50 mg/ml (31.25–500 µg/ml), with correlation coefficients (r²) of 0.999 for metformin and 1.00 for rosiglitazone. The assay method met all ICH, USP, and FDA requirements for validation, thus confirming its accuracy and precision. Therefore, this method can be used routinely for the quantitative analysis of metformin and rosiglitazone in their pharmaceutical dosage forms. The values are presented as reported in the original publication [5].
Chaudhary A, and Singh validated and created a simple, rapid, and accurate RP HPLC technique for quantifying both Remogliflozin and metformin at the same time in both tablet and bulk drug forms. The C18 (2.5 μm size) column (250 × 4.6 mm) separation of the compounds was performed using an isocratic mobile phase of acetonitrile and 20 mmol ammonium formate (60 percent acetonitrile, 40 percent buffer at pH = 3.5) delivered by a 1.0 ml/min. The compounds were detected at 243 nm. For Remogliflozin, the linearity (2.5–25 µg/ml) was established. It was also noted that there was linearity between metformin at 12.5–125 µg/ml. The corresponding LODs for Remogliflozin and metformin were 0.42 and 0.196, respectively. The 100 percent assay results utilizing the validated procedure on the marketed formulations equated to the original formulation's concentrations confirming the method's applicability in routine analysis within pharmaceutical manufacturing facilities [6].
Pandya RH et al. created a quick, reliable, accurate, and simple RP-HPLC procedure that can simultaneously quantitate the levels of Linagliptin and metformin in human plasma. The sample preparation involved protein precipitation. The separation of analytes (Linagliptin, metformin) was accomplished through use of a Grace Vydayec Genesis CN Column (150 × 4.6 mm, 4 μm) with an acetonitrile/0.01 M dipotassium hydrogen phosphate (buffered, pH 7) mobile phase under isocratic conditions at a flow rate of 1.0 ml/min using UV detection at 237 nm. With respect to retention times, Linagliptin had a retention time of 4.95 min; metformin 15.41 min; and, Phenformin (Internal Standard) 11.06 min. The study showed excellent correlation of the two drugs within the calibration curve ranging between 1 ng/ml-32 ng/ml; in addition, this validated method was performed in accordance with the guidelines set by the United States Food and Drug Administration (USFDA) with regard to specificity, sensitivity, precision, accuracy, recovery, and stability. This validated method for quantifying Linagliptin and metformin levels in human plasma makes it suitable for use in bioanalytical applications. The retention time of metformin (15.41 min) is comparatively long for RP-HPLC methods, which may impact analysis time and method efficiency [7].
Rana K. and Sharma developed a straightforward, accurate, precise and reproducible RP-HPLC process is provided for the simultaneous estimation of metformin hydrochloride (MET) and Alogliptin (ALO). Chromatographic separation was achieved using a C18 column (250 × 4.6 mm, 5 μm) with a mobile phase of acetonitrile and OPA water (80:20 v/v, pH 2.5) with a flow rate of 0.9 ml/min and detection at 283 nm. Retention times were found to be 6.366 min and 8.616 min for MET and ALO, respectively. The method was validated following the ICH guidelines and was found to have excellent linearity, precision, robustness, and reproducibility, making it ideal for use in routine quality control analyses of indicated combined dosage forms [8].
Reddy NP and Chevala developed a method that provides very quick, accurate, and precise results when measuring both metformin and Canagliflozin at the same time in tablet formulation. The separation of metformin and Canagliflozin (using this RP-HPLC method) was carried out with an ODS column (250 mm x 4.6 mm, with 5 µm particles) using a buffer-acetonitrile-methanol isocratic mobile phase at a flow rate of 1 ml/min and a 30 °C column temperature, and a PDA detector was used to detect the two compounds at 212 nm. The retention time of metformin is 2.783 min and 3.781 min for Canagliflozin. The method has been validated according to the ICH guidelines and shows good linearity, precision, accuracy, specificity, LOD, LOQ, and robustness. Metformin’s percentage recovery = 100.1% and Canagliflozin’s percentage recovery = 100.2%. Thus, the RP-HPLC method developed by Reddy and Chevala is suitable for routine quality control in pharmaceutical analysis [9].
The RP-HPLC method developed by Edla and Sundhar is simple, rapid, accurate, and precise. A wide range of both metformin and glibenclamide can be estimated with this method simultaneously. In this study sample were separated on an oyster BDS RP-C18 (5 µm,150x4.6 mm) column using an isocratic mobile phase made up of methanol, acetonitrile and water at a flow rate 1.0 ml/min (30:60:10, v/v) and UV detection at 228 nm. metformin had a retention time of 3.17 min, whereas glibenclamide had a retention time of 8.10 min. The RP-HPLC method developed for glibenclamide showed linearity ranging from 2 to 4.5 µg/ml and the method developed for metformin had linearity ranging from 200 to 450 µg/ml; both correlation coefficients were high. The RP-HPLC methods were validated according to ICH (International Conference on Harmonization) guidelines showing precision and accuracy allowing their use in routine estimation of metformin and glibenclamide as fixed-dose combination tablets [10].
Chaturvedi and Sharma developed a rapid, precise, and accurate RP-HPLC (Reversed Phase High Performance Liquid Chromatography) procedure that can simultaneously estimate three drugs—metformin hydrochloride (MET), Pioglitazone Hydrochloride (PIO) and Glibenclamide. The drugs are contained in one lot of tablets. The data obtained were then analysed by their derived method. Their separation on to C18 column (25×4.6 mm, 5 μm), with a mobile phase of Acetonitrile; Potassium Dihydrogen Phosphate Buffer (55:45, = 3.0). The flow rate for the mobile phase was 1.5 ml/min. Detection of the three drugs was through the use of a UV detector at 230 nm. Retention times were 1.362 min for MET, 3.418 min for PIO and 7.395 for GLC. The method was validated with the ICH guidelines for 260.0000, with an acceptable level of performance in the following areas; accuracy, precision, linearity, specificity and sensitivity. For MET and PICO, the calibration range was 200 to 1000 mcg/ml, while for GLC, the range was 50 to 300 mcg/ml. The limit of detection (LOD) for MET, PICO and GLC were 6.3, 15.4 and 8.2 ng/ml, respectively and the limit of quantitation (LOQ) was 19.09, 46.66 and 24.84 ng/ml, respectively. Therefore, the method can be used routinely to quantitatively analyse the three drugs in tablets. The reported LOD values (6.3, 15.4, and 8.2 ng/ml) are consistent with the original study and demonstrate high sensitivity of the method, which may be attributed to optimized chromatographic conditions and detector response [11].
Tripathi and Nirupa created a straightforward, quick, accurate, and dependable RP-HPLC technique for the simultaneous measurement of Glimepiride, Pioglitazone, and metformin in bulk chemical mixtures and pharmacy dose forms. The test was performed on an Inertsil ODS-3V column (250 × 4.6 mm, 5 μm) with a mobile phase containing acetonitrile, tetrahydrofuran, and buffer (pH 5) at a flow rate of 1.7 ml/min and UV detection at 228 nm. The retaining times for Glimepiride, Pioglitazone, and metformin were 5.0 min, 3.9 min, and 1.3 min respectively. The method has been validated with respect to its Precision, Linearity, Accuracy, Ruggedness, and Robustness and used successfully on commercially available tablets providing good separation, matrix effect and reproducibility. It also proved to be suitable for routine quality control analysis [12].
High performance thin-layer chromatography
An HPTLC method developed by Srivani et al. for the stability testing of Linagliptin and metformin simultaneously was validated via estimation via bulk and fixed dose forms. The method was validated using acetone/methanol/chloroform/formic acid (3:1:5:1) on silica gel 60F254 plates and detected at 230 nm. Linearity was observed with R² values of 0.999 for linagliptin and 0.990 for metformin. The results of validation recorded uncompromising accuracy, precision, specificity, and robustness for the method; assessment of degradation by an analysis revealed that there are no interferences from any products produced during stability assays, and therefore the HPTLC method is compatible for use in the routine evaluation of metformin-containing combination medications [13].
Sakhare RS et al. developed and validated a simple and stability-indicating HPTLC method for the simultaneous determination of metformin hydrochloride and Benfotiamine in bulk and combined dosage forms. The analytical method is based on HPTLC on silica gel 60 F254 plates using benzene/methanol/triethylamine (8.5:1:0.5 v/v/v) mobile phase with densitometric detection at 249 nm. The HPTLC analysis of metformin and benfotiamine provides a well-defined separation with respect to retention factor (Rf) values of 0.26 and 0.72, respectively. A linear calibration curve was generated by plotting peak area versus concentration for both metformin and benfotiamine, with R^2 values>0.99 across concentrations of 500-3000 ng/sm and 75-450 ng/sm, respectively. Analysis for the stability of both drugs was determined through forced degradation using acid, base, oxidation, light, and heat. The method has been validated in accordance with ICH guidelines. Furthermore, the method has been successfully applied in the analysis of metformin and benfotiamine in tablet formulations [14].
Bhole RP et al. has successfully developed a stability-indicating HPTLC method for the simultaneous determination of both drugs (metformin hydrochloride and Canagliflozin) to be quantified simultaneously in bulk material and in finished dosage forms (tablets). The chromatographic separation was performed using silica gel (60 F254) plates and the following composition of the mobile phase: methanol: toluene: ethyl acetate: ammonia in the ratio of 2:4:4:0.1 (v/v/v/v). Using densitometric detection at 254 nm, both drugs were successfully resolved with Rf values of 0.15 (metformin) and 0.50 (Canagliflozin). Linearity was established for metformin in the range of 0.5-3.0 µg/band and for Canagliflozin in the range of 50-300 ng/band. The method was validated according to ICH Guidelines regarding accuracy, precision, and robustness. Forced degradation studies indicate that both metformin and Canagliflozin are susceptible to degradation in acidic and basic environments; and that the method effectively isolates the degradation products of these drugs as evidence of its stability-indicating ability in the analysis Mof tablets containing both products. However, the very low proportion of ammonia in the mobile phase may affect reproducibility and robustness of the method [15].
Rank M et al. developed and validated an HPTLC stability-indicating method for the simultaneous determination of Pioglitazone Hydrochloride and metformin hydrochloride in bulk and tablet dosage form. The separation was accomplished on silica gel 60 F254 plates with a mobile phase of butanol: 1,4-dioxane: glacial acetic acid (5:3:2 v/v/v) and was detected at 226 nm. The Rf values for metformin and pioglitazone were 0.17±0.02 and 0.72±0.01 respectively, indicating excellent resolution. The linearity for metformin was determined to be 2000-18000 ng/band, while pioglitazone demonstrated a linear response between 60-540 ng/band. The method demonstrated satisfactory recovery for accuracy, precision, robustness, LOD, and LOQ (98.62-100.62%). Forced degradation studies conducted under acidic, photolytic and thermal conditions verified the stability-indicating ability of the method, ultimately confirming the use of this method for routine analysis of combined formulations containing both drugs [16].
Malgundkar SS and Mulla devise and validate a high-performance thin-layer chromatography (HPTLC) determination and analysis technique capable of simultaneously determining the concentration of metformin hydrochloride and Glibenclamide in bulk, as well as in dosage forms that combine both active ingredients. The drugs were separated on 60F254 Silica Gel aluminum plates utilizing a mobile phase of Methanol: Water: System-0.4% Sodium Sulfate-7:5:11 v/v/v, and were detected using a densitometer at 232 nm (metformin) and 238 nm (Glibenclamide). The relative migration distance measured (Rf) for metformin and Glibenclamide were found to be 0.27 and 0.80, respectively. Over the range of 250-1750ng/spot for either drug, the method was shown to be linear, and upon performing a validation study, the following characteristics were reported: 95.79%-97.84% for metformin, 96%-97.03% for Glibenclamide (Tolerable Recovery),<2% for both day-to-day RSD (Precision) as well as specific for ICH guidelines. Therefore, the method is suitable for routine determinations of combination formulas containing these active ingredients per ICH guidelines [17].
Atul R. Bendale and co-authors have developed and validated a method using high-performance thin-layer chromatography (HPTLC) to simultaneously determine the concentrations of vildagliptin and metformin hydrochloride. The analysis comprised densitometric detection at 217 nm and tested completely using a mixture of Hexane, Methanol, Acetonitrile, and Glacial Acetic Acid with a ratio of 2:3.5:2.5:0.2. This resulted in Rf values of 0.73±0.02 for vildagliptin and 0.22±0.01 for metformin. Both pharmaceutical products were subjected to a variety of stress conditions, including but not limited to, acid, alkali, neutral hydrolysis, oxidative stress, thermal (dry and wet) heat stability, and photodegradation, to support the claim of a stable method for the simultaneous determination of vildagliptin and metformin. Degradation peaks for all test drugs were found to be distinguishable in each method tested. The methods were validated according to their developed analytical parameters of linearity, precision, accuracy, specificity, robustness, limit of detection, limit of quantification, interday precision and intraday precision. The data obtained indicate a straightforward, precise, accurate and reliable method for the analysis of vildagliptin and metformin in both combinations in pharmaceutical dosage forms [18].
An HPTLC technique was developed by Raja and Lakshmana Rao for the simultaneous quantification of metformin hydrochloride and Sitagliptin phosphate in bulk powders as well as in tablet dosage forms using a validated analytical method. The separation was conducted on silica gel 60 F254 plates by employing an acetone: methanol: toluene: formic acid (4:3:2:1, v/v/v/v) mobile phase, with detection at 220 nm wavelength. Results showed that both metformin and sitagliptin were linearly related to both concentration (ng/band) and r² (>0.99) over a concentration range of 2000–5000 ng/band and 200–500 ng/band respectively with respect to each compound being determined; also noted were LODs of 45 ng/band for metformin, and 27 ng/band for sitagliptin; and LOQs of 150 ng/band for metformin, and 87 ng/band for sitagliptin. The results demonstrate that the developed method is accurate, precise and suitable for routine-use based upon meeting ICH guidelines for validation, and provide an excellent means by which to perform routine quantitative analyses on both metformin hydrochloride and sitagliptin phosphate [19].
Thomas AB et al. created and validated a stability-indicating high-performance thin-layer chromatography (HPTLC) approach for simultaneous determination of nateglinide and metformin hydrochloride in combination pharmaceutical dosage forms. A chromatographic separation was performed on pre-coated silica gel plates using a mobile phase of chloroform: ethylacetate: acetic acid (4:6:0.1 v/v/v) with densitometric detection at 216 nm. The method demonstrated good linearity within the 200 to 2400 ng/band range for nateglinide (r² = 0.996) and 500 to 3000 ng/band for metformin (r² = 0.995). The percentage of accuracy was 99.72% for nateglinide and 100.08% for metformin. Forced degradation studies under acidic, alkaline, oxidative, thermal, wet heat, and photolytic conditions produced well-defined degradation products with unique Rf values, further validating the method’s stability-indicating capability and its use in routine quality control analysis [20].
Dharmamoorthy G et al. developed and validated a simple, precise, and stability-indicating HPTLC method for the simultaneous estimation of metformin hydrochloride and Pioglitazone in pharmaceutical dosage forms. The HPTLC method employs a mobile phase comprised of toluene: methanol: triethylamine (6:4:0.1 v/v/v) on HPTLC plates with a densitometric detector at 230 nm to achieve separation. The value of the Rf for metformin hydrochloride was 0.25±0.03 and for pioglitazone, was 0.47±0.04. The method was validated in accordance with ICH guidelines and was found to have good accuracy since the recovery values were greater than 96 %. Interference from tablet excipients did not occur. The reported method was rapid, simple, and suitable for routine quality control analysis of the combined dosage form [21].
Desai SA et al. created a reliable and stable High-Performance Thin Layer Chromatography (HPTLC), for simultaneously determine metformin, dapagliflozin, and Saxagliptin in bulk and pharmaceutical formulations, by using Box-Behnken design based on AQBD principles. The stationary phase consist of 60 F254 silica gel plates, while the mobile phase consists of methanol and 0.5% aqueous ammonium sulfate in the ratio 8:2 (w/v) at pH 5.5; the analytes were detected at 222 nm. Excellent linearity of coefficients above 0.990 were obtained, with relative standard deviation between 0.5-2.0% and recovery between 96.7-99.54%. This method has been validated by following the International Conference on Harmonisation Guidelines for Good Manufacturing Practice pharmaceutical products, and successfully tested on forced degradation studies with acid, base, oxidizing agent and UV radiation [22].
UV spectroscopic method
Sen AK et al. developed and validated three UV spectrophotometric methods, namely simultaneous equation, absorbance ratio, and first derivative methods, for the simultaneous estimation of teneligliptin and metformin in tablet dosage form. The method showed excellent linearity, high sensitivity, and was validated for precision, accuracy, and robustness, making it suitable for routine pharmaceutical analysis [23].
Ahmed MK et al. developed a specific, precise, and accurate UPLC method for the simultaneous estimation of glimepiride, metformin, and voglibose in bulk and marketed oral dosage forms. The method used a Hypersil C18 column Derivative method). The methods demonstrated linearity for both drugs over the range of 1-20 μg/ml. The validation was conducted according to ICH guidelines; the methods were demonstrated to be accurate, precise, and sensitive. Statistical analysis revealed that no significant difference existed between any of the three methods, indicating they can be used for the routine quality control of these drugs in pharmaceutical formulations [24].
Four basic and economical UV-spectrophotometric methods, validated by Sen et al., are able to determine Remogliflozin, Vildagliptin, and metformin by tablet dosage forms. Each one employs a different technique: a simultaneous equation, a ratio difference in spectroscopy, the method through derivative ratio spectrum zero-crossing, and the technique of double divisor ratio spectrum derivative. Each of the drugs was linear from 2.5-15 µg/ml, and each of the methods was validated for precision, accuracy, and sensitivity based on the International Conference on Harmonization of Technical Requirements for Pharmaceuticals for Human Use [25]. Sen et al. conclude that their methods are simple, Rapid, and inexpensive, making them suitable for routine use in drug analysis and marketed formulations published [25].
K Bhavyasri et al. developed A new simple UV-visible spectrophotometric technique for simultaneous determination of dapagliflozin and metformin hydrochloride has been generated and validated by two or more equations through combined methods based on the simultaneous equations method of calculating concentrations using absorbance values obtained at two different wavelengths with established linearity for both compounds in their established concentration ranges (2µg/ml to 32µg/ml and 1µg/ml to 20µg/ml with R2 = 0.999) As well both of the compounds exhibit high levels of accuracy (% recovery 96.82% to 99.80% dapagliflozin; 98.15% to 99.35% metformin hydrochloride) and precision (%RSD<1% dapagliflozin; %RSD<1% metformin hydrochloride). Additionally, both compounds undergo degradation via four different methods of degradation (acidic, base, oxidative, thermal and light), as well it confirms that this method is appropriate for use as a routine method of quality control [26].
Mahesh Attimarad et al. developed a simple method for simultaneous determination of metformin hydrochloride and remogliflozin etabonate in pharmaceutical formulations by UV derivative spectroscopy and RP-HPLC. The chromatographic separation was achieved using a C18 monolithic column and the methods were optimized using a Box – Behnken design model. UV and HPLC methods exhibited linear relationships for metformin in the regions of 2 – 30 μg/ml and 5 – 200 μg/ml, respectively, and remogliflozin in the regions of 1 – 24 μg/ml and 2 – 150 μg/ml, respectively. Average assay values were about 99 – 100% and thus demonstrate that both methods are accurate, precise, and appropriate for routine quality control of combined drug product formulations [27].
Manojkumar K Munde and others the four effective spectrometric techniques, namely simultaneous equation, absorbance ratio, area under the curve and first derivative spectroscopy were investigated with regard to their validity in estimating the concentration of Empagliflozin and metformin hydrochloride in both bulk and tablet. Both Empagliflozin and metformin hydrochloride were analysed using UV light at 224 nm for Empagliflozin and 232 nm for metformin hydrochloride, respectively and all four methods produced reputable, rapid, reliable and low-cost results, thereby giving them potential as suitable options for routine quality control analyses of combined pharmaceutical products [28].
Jayasundara U. K. et al. created a lightweight UV/Vis spectrophotometric approach to quantify metformin hydrochloride and Atorvastatin Calcium in tablets under Good Laboratory Practice (ICH) guidelines. Linearity was demonstrated in the ranges of 2–10 mg/l for metformin (R-squared = 0.999) and 5–15 mg/l for atorvastatin (R-squared = 0.998). In terms of accuracy, recoveries ranged from 92.14% to 95.04% for metformin and from 90.10% to 102.90% for atorvastatin. Therefore, the methodology developed by these authors is technically and functionally adequate for routine quantitative analysis of both drug compounds contained in their dosage forms. The lower recovery value (~90%) for atorvastatin may be considered marginal and should be further optimized for analytical accuracy [29].
Cholke P et al. have created an easy and fast UV-Visible spectroscopy technique for measuring both Saxagliptin Hydrochloride (Sax) and metformin hydrochloride (Met) at the same time, in a tablet form. The maximum absorbance wavelengths (λmax) were determined as being 274 nm for saxagliptin and 231 nm for metformin. Both drugs followed Beer’s law in terms of concentration at 50-90 μg/ml for saxagliptin and 2-10 μg/ml for metformin. Accuracy results (i. e., Recovery %) were cost-effective at 100.10% for saxagliptin and 99.98% for metformin. Validation studies of the method were performed in accordance with the International Council for Harmonisation of Technical Requirements for Pharmaceuticals for Human Use (ICH) guidelines, and the results demonstrated that the method is accurate, precise, and appropriate for the determination of both saxagliptin and metformin in tablets [30].
Majithia RH et al. A Q-absorption ratio UV spectrophotometric technique was created and validated to simultaneously assess Anagliptin and metformin hydrochloride in a synthetic combination. An iso-absorptive point (238 nm) was found for both compounds, with 233 nm representing the λmax of metformin. The linear response was assessed from 2 to 12 µg/ml for anagliptin and 5 to 30 µg/ml for metformin (r>0.999). Recovery experiments displayed excellent accuracy with 100.42-101.83% for anagliptin and 99.94-101.63% for metformin. Both drugs were promptly and precisely identified (%RSD<2), indicating that the technique may be utilized for simultaneous analysis of both substances quantitatively [31].
Prasanth VG et al. created Two UV spectrophotometric techniques to measure Repaglinide and Metformin hydrochloride simultaneously in a synthetic combination. The 1st technique was identified as the Simultaneous Equation Method; wavelengths 284 nm and 237 nm were used. The 2nd technique was identified as the Q-Absorbance Ratio Method, which involved measuring at 237 nm, and 254 nm, respectively. The two techniques showed linearity in the ranges of 10-50 μg/ml for Repaglinide and 1.5-7.5 μg/ml for metformin. Each method was validated in accordance with the ICH standards for pharmaceuticals for humans and were concluded to be accurate, precise, rapid, and appropriate for routine analysis of those substances [32].
Sen AK et al. created and validated four distinct UV spectrophotometric techniques to analyze Empagliflozin, Linagliptin, and metformin hydrochloride simultaneously when used together in a ternary formulation. The four methods used were the simultaneous equation method, ratio difference spectrophotometry, derivative ratio zero crossing, and the double divisor ratio derivative. For each of the three compounds, wavelengths of 224.6 nm, 226 nm, and 237.2 nm were chosen. The simultaneous equation method produced linear responses between 2-10 µg/ml; while the other three methods yielded linear responses of 0.5-10 µg/ml. Validation per ICH guidelines produced satisfactory results regarding accuracy, precision, and sensitivity for all four methods. Thus, all four methods developed by Sen et al., when used as directed, will provide an economical, rapid means to routinely obtain the simultaneous measurement of these three compounds contained in pharmacy products [33].
Ultra-performance liquid chromatography
Narikimalli A et al. developed an ultra-performance liquid chromatography (UPLC) method that is Rapid and capable of simultaneously determining both nateglinide and metformin hydrochloride quickly and at the same time using a C18 column with an ammonium formate buffer and acetonitrile (75:25 v/v) as the mobile phase. The analysis utilizes the following parameters: 0.2 ml/min flow rate; UV detection at 260 nm; retention times for nateglinide = 1.014 min and metformin = 1.435 min; total run time = 3 min. The results of the method show that it has high linearity, precision/%RSD<1%, and accuracy (approximately 99% recovery). It also provides evidence to support the robustness of this analytical technique and its use in routine quality control testing of pharmaceutical products. Due to the close retention times, adequate resolution (Rs>2.0) must be ensured to avoid peak overlap [34].
Fouad MM et al. developed a fast, sensitive method using the RP-UPLC to simultaneously determine the amount of vildagliptin in relation to metformin hydrochloride and ciprofloxacin hydrochloride in relation to dexamethasone sodium phosphate. To achieve this, they employed a Phenomenex C18 column (100 × 2.1 mm, 1.8 µm) and used potassium dihydrogen phosphate buffer and acetone in a variety of ratios as the mobile phase at a flow rate of 1 ml/min. The detection was done at 220 and 254 nm. The study demonstrated that this method had good linearity across the concentration ranges of Vildagliptin (0.5 to 5 µg/ml), metformin (5 to 50 µg/ml), Ciprofloxacin (2 to 20 µg/ml), and Dexamethasone (2 to 20 µg/ml). This RP-UPLC method is also reproducible, accurate, robust, and well-suited for routine pharmaceutical testing due to its short retention time [35].
Ahmed O et al. produced a method with great specificity and accuracy, an ultra-performance liquid chromatography method for measuring the amount of sitagliptin and metformin found in both bulk dosage form (tablets) and tablet dose. This method utilizes a Hypersil C18 column (100 × 2.1 mm, 1.7 μm) with a mobile phase of octanesulfonic acid and acetonitrile (35:65 v/v). The gradient flow is set at 1.0 ml/min and operates under 260 nm. The method has demonstrated excellent linearity from 20-100 mcg/ml and validation of the method meets ICH guidelines. Precision and accuracy have been established, and the interference of ingredients has not been detected, therefore, this method has been recommended for ordinary use in the pharmaceutical industry [36].
Suryanarayana MV et al. developed a method with The RP-UPLC is a fast, specific, precise way to simultaneously analyze sitagliptin phosphate monohydrate and metformin hydrochloride in their respective formulations. This method utilized an Acquity UPLC BEH C8 column (100 mm x 2.1 mm, 1.7 micron), a mobile phase composed of potassium dihydrogen phosphate and hexanesulfonic acid in combination with acetonitrile, with a gradient run at flow rates of 0.2 ml/min, and detection at 210 nm. The method has demonstrated sensitivity with low LOD and LOQ values; it was demonstrated to be linear, accurate, precise, specific, and robust in validation. In addition, it has been shown to be a stability-indicator and appropriate for use in routine analysis [37].
Tammi Setty MR et al. developed a rapid and selective UPLC-PDA method for the simultaneous estimation of remogliflozin and metformin hydrochloride in bulk, formulation, and trace-level cleaning samples. The method u (100 × 2.1 mm, 1.7 μm) with acetonitrile and methanol (68:32 v/v) as the mobile phase in gradient mode at a flow rate of 1.0 ml/min and detection at 260 nm. The method showed good linearity (20–100 μg/ml), low LOD (0.2099 μg/ml) and LOQ (0.6362 μg/ml), and no interference from excipients. It was validated as per ICH guidelines and successfully applied to routine analysis of the combined drugs [38].
Alshora D et al. developed a new UPLC method to quickly quantify sitagliptin and metformin in quality control samples and generic tablet forms using a Box-Behnken design. The QBD development process included optimization of the mobile phase composition, flow rate, and buffer strength. Separation occurred in only two minutes; sitagliptin had a retention time of 0.73 min, while metformin's was 1.36 min. The UPLC method was validated according to ICH guidelines making it appropriate for the everyday analysis of combination tablets such as Janumet 50/850 [39].
Tadesse Unade and pawar produced a new UPLC analysis for metformin and gliclazide in bulk and pharmaceutical products, who created a quick, sensitive, and stability-indicating method. The Lunna C18 column (100 × 2.6 mm, 1.6 μm) was utilized in conjunction with trifluoroacetic acid (70:30 v/v) as the mobile phase at a flow rate of 1 ml/min which was detected at 227 nm. Metformin and gliclazide retention times were found to be 1.719 min and 2.845 min, respectively. In addition, the new method was found to have excellent linearity, an average recovery in the range of 99.63–101.23%, low limits of detection and both accuracy (%RSD<1.11%). Furthermore, the forced degradation studies demonstrated the required stability-indicating characteristics necessary to facilitate routine quality control [40].
Dinh C. D. et al. created a quick, specific, and eco-friendly UPLC-MS/MS technique to simultaneously quantify metformin and glimepiride levels in human plasma. The analytical agents were extracted from the plasma by precipitating the protein with acetonitrile containing 0.1% formic acid, using glipizide as the internal standard. The separation of the analytes was accomplished on a BEH C18 column (50 mm × 2.1 mm and 1.7 μm) with a water-acetonitrile (both with 0.1% formic acid) gradual elution. Analytes were determined by tandem mass spectrometry with a positive ionization. The method demonstrated good linearity (metformin: 1 to 100 ng/ml; glimepiride: 0.25 to 25 ng/ml), high recovery (>85%), and less than 15% CV, making it a sensitive, rapid, and eco-friendly method for monitoring drugs in the plasma [41].
The method of Gopal N. M. and Sridhar for determining both metformin hydrochloride and empagliflozin in bulk and tablet dosage forms is a straightforward, accurate, and precise UPLC method that has been validated. The mobile phase was composed of a phosphate buffer (pH 3) and methanol (30:70, v/v) at a flow rate of 1.0 ml/min using a Dikma C18 column (50 × 2.1 mm, 1.8 μm) for detection at 240 nm. Metformin and empagliflozin retention times were 1.189 and 1.712 min, respectively. The method was linear, showed excellent recovery (≈100%), and demonstrated specificity when subjected to stress testing, making it stability-indicating and appropriate for routine quality control purposes [42].
LC-MS/MS (Liquid chromatography – mass spectroscopy)
Wang L et al. created a sensitive and validated LC-MS/MS technique to allow for the simultaneous quantification of apixaban (APB) and metformin (MET) from rat plasma. Rivaroxaban was used as the internal standard. The separation was performed on an Inertsil ODS3 C18 column (150 × 4.6 mm, 5 μm) using isocratic elution, and detection was carried out by multiple reaction monitoring (MRM) in positive electrospray ionization (ESI) mode. The method’s linear range for both drugs was as follows: for APB 0.5 to 250 ng/ml and for MET 8 to 8000 ng/ml. There was a %RSD of less than 12.5%, and the accuracy was within-8.6% to 12.4%. The method was utilized to conduct a pharmacokinetic drug-drug interaction study, demonstrating an altered plasma exposure of APB and MET when both drugs are co-administered, likely due to a drug-drug interaction involving alterations in the organic cation transporter (OCT). The reported analytical parameters are presented as described in the original publication [43].
Kim NS et al. [44] developed and validated an LC–MS/MS method for the simultaneous detection of 26 antidiabetic drugs in adulterated dietary supplements, demonstrating good linearity (R²>0.99), LOD of 0.16–20 ng/ml, and LOQ of 0.5–60 ng/ml [44].
Gumieniczek A et al. assessed the stability of metformin and repaglinide in their solid states as well as in solution with LC-UV analysis, LC-MS, and FT-IR spectroscopy under different stressful conditions (high temperature/humidity, ultraviolet/visible light sources, various pH values, and oxidative media). Metformin showed significant degradation under alkaline conditions, whereas repaglinide exhibited the most rapid degradation under acidic and oxidative conditions. Two new degradation products were identified for dapa, and nine were identified for repaglinide using LC-MS. FT-IR analysis demonstrated that the stability of metformin and repaglinide was influenced by excipients such as povidone (PVP), mannitol, and magnesium stearate. LC-UV analysis was validated to assess degradation rate kinetics of both drugs, and both LC-MS and FT-IR analyses were authorized for identification of stress-induced degradation products [45].
Polagani SR et al. developed a sensitive LC-MS/MS method for the simultaneous quantification of atorvastatin, metformin, and glimepiride in human plasma. Carbamazepine was the internal standard, and the plasma samples were prepared by protein precipitation using acetonitrile. The separation of the analytes was performed on an Alltima HP C18 column using a mobile phase of 60% acetonitrile and 10 mmol ammonium acetate, pH 3.0, at a flow rate of 1.1 ml/min. The method demonstrated linearity with r2 values ≥ 0.99 within each analyte’s corresponding concentration range. The intra-and inter-day precision and accuracy of each analyte were below acceptable limits; all analytes showed stability when tested. The total analytical time (2.5 min) provided sufficient throughput for high-volume analysis. This rapid analytical method has been successfully employed in a human pharmacokinetic study [46].
Ramisetti M et al. A fast and accurate LC–MS/MS method was established to simultaneously quantify Canagliflozin and Metformin in human plasma samples. Plasma samples were processed using protein precipitation with deuterated internal standards. The chromatographic separation was performed on a C18 column using an isocratic mobile phase consisting of ammonium acetate (5 mmol) containing 0.01% formic acid and methanol. The validated method was shown to provide linearity for Canagliflozin (10-6028 ng/ml) and Metformin (10-3027 ng/ml), with precision, accuracy and stability testing in compliance with FDA requirements. The method has been successfully utilized in a human pharmacokinetic study [47].
A sensitive and precise LC-MS/MS method was developed for the simultaneous estimation of dapagliflozin and Metformin in tablets. Separation was performed on a C18 column using an isocratic mobile phase of ammonium acetate and acetonitrile, with detection by MRM in positive electrospray mode. The method showed good linearity, low detection limits, and was validated according to ICH guidelines, making it suitable for routine analysis of these drugs in pharmaceutical dosage forms [48].
An efficient, straightforward and accurate LC-MS/MS assay was created to measure both rosuvastatin (ROS) and metformin (MET) at the same time in individuals’ plasma. The sample prep was performed using protein precipitation by adding acetonitrile; followed by drying down to leave residue before reconstituting to prepare for analysis. The column used for chromatography was a ThermoHypurity C18; mobile phase 0.1% formic acid in water and acetonitrile (30:70 v/v); 0.4 ml/min. The results of the method produced great linearity; ROS was 0.5-200 ng/ml and MET was 2-2000 ng/ml, both with r>0.9994, and showed high precision and robust performance during stability testing. The developed assay has been validated and will be used in the conduct of a human pharmacokinetic study [49].
Prasad PB. et al. developed a novel LC-MS method for the simultaneous determination of metformin, linagliptin, and saxagliptin in pharmaceutical formulations. The LC‑MS method makes use of a Hypurity Advance C‐18 column as the stationary phase and methanol: ammonium acetate buffer (pH 4.5) in a volume ratio (v/v) of 85:15 and a flow rate of 0.5 ml/min. In the positive ion mode using mass spectrometry (MS), individual mass transitions of m/z 130.10/70.10, m/z 473.10/420.40, and m/z 316.30/180.20 were identified as suitable analytes for metformin, linagliptin, and saxagliptin, respectively. Validation of the LC‑MS method adhered to ICH guidelines demonstrated a proven linearity (50–5000 ng/ml); accuracy (94–102%); precision (≤4.67% relative standard deviation [RSD]). Assays of the three drug formulations have been conducted under the influences of degradation products and were concluded to be highly accurate and precisely determined within expected levels [50].
In 2019, Mohamed D. and et al. developed an extremely sensitive and specifically selective LC–MS/MS technique for simultaneous quantification of metformin and canagliflozin in human plasma. They used a two-step passive extraction (first precipitating proteins, followed by extracting with ethyl acetate). They separated metformin and canagliflozin chromatographically on a C18 50 × 4.6 mm, 5 μm column with an isocratic mobile phase of 0.1% formic acid/acetonitrile (60:40, v/v) and detected using a triple quadrupole mass spectrometer in multiple reaction monitoring (MRM) mode. Linearity was found: metformin (50–5000 ng/ml) and canagliflozin (10–1000 ng/ml); recovery was>90%; and accuracy was within 88.14–113.05% (RSDs,<10%). The method was successfully used to evaluate pharmacokinetics in healthy subjects [51].
Method benefits and limitations
HPLC (High-Performance Liquid Chromatography) is one of the most widely used analytical techniques for pharmaceutical analysis because of its high accuracy, precision, reproducibility, and versatility. However, HPLC methods often require extensive sample preparation, large solvent consumption, longer analysis times, and regular maintenance of chromatographic systems. Improper mobile phase selection or prolonged column use may also reduce column efficiency and method robustness [3-6, 11, 12].
It was not an accident that HPLC has gained its position as the leading analytical technique. The major advantage is that it applies to many types of analytes, from small organic molecules and ions to very large molecules, including biopolymers. In particular, the ability of HPLC to be coupled with MS has made HPLC an "ideal analytical tool" by combining superior separation performance with unparalleled sensitivity and specificity of MS. As a result, HPLC-MS will be a primary technology for bioanalytical testing (drugs in biological fluids), residual trace analysis of food, forensic and environmental testing samples, and life sciences research [43–46]. HPLC with UV detection is having an increasingly important role in QC due to its unmatched reproducibility and reliability [7, 8, 23]. An example of this is provided in a case study about the stability of a pharmaceutical product.
Using traditional HPLC, a peak capacity of approximately 200 for a gradient run with 20,000 theoretical plates. However, with UPLC you can increase peak capacity (peak capacity=how many peaks can you get in a single run) to a peak capacity of 400-1000 with a response time of approximately 60 min (9-12-16). Additionally, 2D-LC can further increase peak capacity for the complete analysis of highly complex samples in the areas of proteomics and metabonomics [9, 12, 16, 33–40].
Table 1: Comparative summary of analytical methods for metformin and its combinations.
| Method | Drugs analyzed | Column/instrument | Mobile phase | Linearity range | Retention time (min) | LOD/lOQ | Key validation results | Ref. |
| RP-HPLC | Metformin+Miglitol | C18 column | Phosphate buffer (pH 5.3): Methanol (60:40) | MET: 200–500 µg/ml | 3.86, 7.56 | NR | Accurate and validated method | [3] |
| RP-HPLC | Metformin+Dapagliflozin | Phenomenex C18 (250 × 4.6 mm) | Water: Methanol (50:50) | MFH: 2–7 µg/ml; DGL: 60–210 µg/ml | NR | NR | %Assay ~99%, precision<1% | [4] |
| RP-HPLC | Metformin+Rosiglitazone | C18 column | Buffer (pH 3.5): ACN (60:40) | 0.031–0.50 µg/ml | 3.35, 11.95 | NR | Validated as per ICH | [5] |
| RP-HPLC | Remogliflozin+Metformin | C18 column | ACN: Ammonium formate buffer | MET: 12.5–125 µg/ml | NR | NR | Good linearity and precision | [6] |
| RP-HPLC | Linagliptin+Metformin | CN column | ACN: phosphate buffer | 1–32 ng/ml | 1.189, 1.712 | NR | Suitable for bioanalysis | [7] |
| RP-HPLC | Metformin+Alogliptin | C18 column | ACN: OPA water (80:20) | NR | 6.36, 8.61 | NR | Accurate and reproducible | [8] |
| RP-HPLC | Metformin+Canagliflozin | ODS column | Buffer: ACN: Methanol | NR | 2.78, 3.78 | NR | Validated method | [9] |
| RP-HPLC | Metformin+Glibenclamide | C18 column | Methanol: ACN: Water | MET: 200–450 µg/ml | 3.17, 8.10 | NR | Good precision | [10] |
| RP-HPLC | Metformin+Pioglitazone+Glibenclamide | C18 column | ACN: Buffer (55:45) | 200–1000 µg/ml | ~15.41 (long RT) | ng/ml level | Extended run time | [11] |
| HPTLC | Metformin combinations | Silica gel plate | Methanol-based systems | µg range | Not applicable | ng/band | Stability-indicating methods | [13–18] |
| UV Spectroscopy | Metformin combinations | UV-Vis spectrophotometer | Solvent-based | 1–20 µg/ml | Not applicable | ng/ml range | Simple and economical | [23–30] |
| UPLC | Nateglinide+Metformin | UPLC system | Gradient system | NR | 1.014, 1.435 | NR | High resolution | [33] |
| UPLC | Sitagliptin+Metformin | UPLC system | Octanesulfonic acid: ACN | 20–100 µg/ml | ~1–2 min | NR | Fast analysis | [39] |
| LC-MS/MS | Apixaban+Metformin | C18 column | Formic acid+methanol | APB: 0.5–250 ng/ml; MET: 8–8000 µg/ml | NR | High sensitivity | Pharmacokinetic study | [43] |
| LC-MS/MS | Multiple antidiabetic drugs | C18 column | Gradient (formic acid+methanol) | Wide range | NR | LOD: 0.16–20 ng/ml | Highly sensitive and selective | [44] |
| LC-MS/MS | Metformin+others | LC-MS/MS system | Various | NR | NR | NR | Used in plasma studies | [46–51] |
LOD: limit of detection; LOQ: limit of quantification; RT: retention time; MFH: metformin hydrochloride; NR = Not Reported in the original publication; APB = Apixaban; DGL = Dapagliflozin. All methods were validated as per ICH guidelines unless otherwise specified.
Data compiled from references [3–51].
HPLC (High-Performance Liquid Chromatography) is a widely used analytical technique for the separation, identification, and quantification of chemical compounds. However, it can be a long and tedious process when done as a part of a regulated analysis, such as under good manufacturing practices (GMP). A typical HPLC process involves the steps of weighing reference standards, preparing samples and mobile phases, setting up the column along with all the other required modules, performing system suitability tests, injecting reference standards to calibrate the system then analyzing the samples, performing peak integrations, reporting results, reviewing results and signing off. Fortunately, most of these steps are now automated via precision instruments for routine analyses and thus obtain highly reproducible results when compared to other measurement techniques used to identify and quantify raw materials (such as using a hand-held Raman spectrometer-which merely involves pointing the laser at the sample, pressing a button and receiving a pass/fail result that is documented in accordance with GMP within seconds) [23, 53]. Despite its advantages in accuracy and reproducibility, HPLC may be less efficient than advanced techniques such as UPLC and LC–MS/MS in terms of analysis time and throughput.
Critical comparison of analytical methods
The reviewed analytical methods demonstrate significant advancements in the determination of metformin and its combinations in pharmaceutical formulations and biological matrices. RP-HPLC was the most frequently employed analytical technique because of its simplicity, reliability, widespread availability, and cost-effectiveness. Most RP-HPLC methods showed satisfactory accuracy, precision, robustness, and linearity, making them suitable for routine quality control analysis.
LC-MS/MS methods exhibited superior sensitivity and selectivity compared with conventional chromatographic techniques, particularly for pharmacokinetic and bioanalytical studies. However, these methods require sophisticated instrumentation, skilled operators, and higher operational costs. UPLC methods offered shorter analysis times, improved resolution, and reduced solvent consumption, making them advantageous for high-throughput laboratories.
Although UV spectrophotometric methods were simple and economical, they generally demonstrated lower selectivity and sensitivity than chromatographic techniques, especially for complex mixtures. HPTLC methods provided cost-effective analysis and the ability to process multiple samples simultaneously but showed comparatively lower sensitivity than HPLC-and LC-MS/MS-based methods.
A comparison of the reviewed studies indicates that no single analytical method is universally superior for all applications. The selection of an appropriate method depends on the analytical objective, required sensitivity, available instrumentation, sample matrix, and regulatory requirements. Future research should focus on developing environmentally friendly, rapid, highly sensitive, and cost-effective analytical methods while incorporating automation and advanced detection technologies.
Conclusion
This review summarizes the various analytical methods reported for the determination of metformin and its combinations in pharmaceutical formulations and biological matrices. Among the reviewed techniques, RP-HPLC was the most widely employed because of its simplicity, reliability, accuracy, and cost-effectiveness. UPLC and LC-MS/MS methods demonstrated superior sensitivity, selectivity, and analytical performance, making them particularly suitable for bioanalytical and pharmacokinetic applications. HPTLC and UV spectrophotometric methods provided economical alternatives for routine analysis but generally exhibited lower sensitivity compared with advanced chromatographic techniques.
A comparative evaluation of the reviewed studies indicates that the choice of analytical method depends on the intended application, required sensitivity, sample matrix, available instrumentation, and regulatory requirements. Although significant progress has been made in analytical method development, there remains a need for rapid, environmentally friendly, highly sensitive, and cost-effective methods that can support both pharmaceutical quality control and bioanalytical investigations.
Future research should focus on the development of green analytical methodologies, automation of analytical workflows, advanced hyphenated techniques, and improved analytical platforms capable of providing enhanced sensitivity, robustness, and operational efficiency. Such developments will further strengthen the analytical assessment of metformin and its combination therapies in pharmaceutical and clinical applications.
Abbreviations
ALO – Alogliptin; AMPK – Adenosine Monophosphate-Activated Protein Kinase; APB – Apixaban; AQbD – Analytical Quality by Design; BEH – Bridged Ethylene Hybrid; CE – Capillary Electrophoresis; CIP – Ciprofloxacin; CN – Cyano Column; CREB – cAMP Response Element-Binding Protein; CV – Coefficient of Variation; DEXA – Dexamethasone; DGL – Dapagliflozin; DM – Diabetes Mellitus; ESI – Electrospray Ionization; FDA – Food and Drug Administration; FT-IR – Fourier Transform Infrared Spectroscopy; GLC – Glibenclamide; GLIC – Gliclazide; GLM – Glimepiride; GLP – Good Laboratory Practice; GMP – Good Manufacturing Practice; HIV – Human Immunodeficiency Virus; HPLC – High Performance Liquid Chromatography; HPTLC – High Performance Thin Layer Chromatography; ICH – International Council for Harmonisation; IS – Internal Standard; LC–MS – Liquid Chromatography–Mass Spectrometry; LC–MS/MS – Liquid Chromatography–Tandem Mass Spectrometry; LINA – Linagliptin; LKB1 – Liver Kinase B1; LOD – Limit of Detection; LOQ – Limit of Quantification; MET – Metformin; MFH – Metformin hydrochloride; MRM – Multiple Reaction Monitoring; M. tb – Mycobacterium tuberculosis; NATE – Nateglinide; NIDDM – Non-Insulin Dependent Diabetes Mellitus; ODS – Octadecyl Silane; OCT – Organic Cation Transporter; OPA – Orthophosphoric Acid; PIO – Pioglitazone; PDA – Photodiode Array Detector; PK – Pharmacokinetics; QbD – Quality by Design; Rf – Retention Factor; ROS – Rosiglitazone; RP-HPLC – Reverse Phase High Performance Liquid Chromatography; RP-UPLC – Reverse Phase Ultra Performance Liquid Chromatography; RSD – Relative Standard Deviation; SAX – Saxagliptin; TB – Tuberculosis; TORC2 – Transducer of Regulated CREB Protein 2; UPLC – Ultra Performance Liquid Chromatography; USFDA – United States Food and Drug Administration; UV – Ultraviolet; VOG – Voglibose.
Acknowledgement
The authors acknowledge Dr. K. R. Khandelwal, Principal, JSPM’s Rajarshi Shahu College of Pharmacy and Research, Tathawade, Pune, for providing facilities to conduct this study.
Funding
No funding was received for conducting this study.
Availability Statement
The datasets generated and/or analyzed during the current study are available from the corresponding author on reasonable request.
AI Use Disclosure Statement
The authors used ChatGPT (OpenAI) during the preparation of this manuscript for language editing, gmar correction, formatting assistance, and improvement of manuscript clarity. The authors carefully reviewed, edited, and verified all generated content and take full responsibility for the accuracy, integrity, and originality of the final manuscript.
Authors Contributions
Conceptualisation: Manjiri M. Shastri; Literature Search and Original Draft Preparation: Aradhana Deshmukh; Reviewing, Editing, and Formatting: Manjiri M. Shastri, Dr Rajendra B. Patil.
Conflict of Interests
The authors declare that they have no competing interests.
References
Katzung BG, Vanderah TW. Basic and Clinical Pharmacology. 15th ed. New York: McGraw-Hill Education; 2021. Available from: https://accessmedicine.mhmedical.com.
Tallam AK, Alapati S, Nuli MV. A review of analytical techniques for determination of metformin: present and perspectives. Int J Heal Care Bio Sci. 2023;4(1):18-24. doi: 10.46795/ijhcbs.v4i1.417.
Bhoomaiah B, Jaya Shree A. Development and validation of RP-HPLC method for simultaneous determination of metformin and miglitol in bulk and pharmaceutical formulation. Int J Pharm Pharm Sci. 2014;6(6):135-41.
Bhavyasri K, Surekha T, Begum S, Sumakanth M. RP-HPLC method for dapagliflozin and metformin HCl in bulk and combined formulation. Arch Pharm Pract. 2021;12(4):106-10. doi: 10.51847/czxl0wyryr.
Akteruzzaman M, Rahman A, Sultan MZ, Islam F, Salam MA, Rashid MA. Development and validation of a simple RP-HPLC method for simultaneous estimation of metformin hydrochloride and rosiglitazone in pharmaceutical dosage forms. Dhaka Univ J Pharm Sci. 2013;11(2):157-63. doi: 10.3329/dujps.v11i2.14574.
Chaudhary A, Kumar Singh BK. Method development and validation for simultaneous quantification of remogliflozin and metformin in bulk and tablets by RP-HPLC. Res J Pharm Technol. 2022;15(10):4709-14. doi: 10.52711/0974-360X.2022.00791.
Pandya RH, Rathod R, Maheswari DG. Bioanalytical method development and validation for simultaneous determination of linagliptin and metformin in human plasma by RP-HPLC method. Pharmacophore. 2014;5(2):202-18.
Rana K, Sharma P. Analytical method development and validation for the simultaneous estimation of metformin hydrochloride and alogliptin by RP-HPLC in bulk and tablet dosage forms. Res J Sci Technol. 2021;13(2):111-8. doi: 10.52711/2349-2988.2021.00017.
Reddy NP, Chevala NT. RP-HPLC method development and validation for simultaneous estimation of metformin and canagliflozin in tablet dosage form. Int J Pharm Sci. 2015;5(4):1155-9.
Edla S, Sundhar BS. New analytical method development and validation for simultaneous estimation of metformin and glibenclamide in bulk and tablet dosage form using RP-HPLC. Rasayan J Chem. 2014;7(1):56-62.
Chaturvedi PC, Sharma R. Development and validation of an RP-HPLC method for simultaneous analysis of a three-component tablet formulation containing metformin hydrochloride, pioglitazone hydrochloride, and glibenclamide. Acta Chromatographica. 2008;20(3):451-61. doi: 10.1556/AChrom.20.2008.3.11.
Nirupa G, Tripathi UM. RP-HPLC analytical method development and validation for simultaneous estimation of three drugs: glimepiride, pioglitazone, and metformin and its pharmaceutical dosage forms. J Chem. 2013;2013(1):726235. doi: 10.1155/2013/726235.
Srivani J, Umamahesh B, Veeresham C. Development and validation of stability-indicating HPTLC method for simultaneous determination of linagliptin and metformin. Int J Pharm Pharm Sci. 2016;8(1):112-5.
Sakhare RS, Pekamwar SS, Mohkare DP. Development and validation of stability indicating HPTLC method for the determination of metformin hydrochloride and Benfotiamine in bulk and combined dosage form. Indian J Pharm Educ Res. 2017;51(2s):s8-s16. doi: 10.5530/ijper.51.2s.44.
Bhole RP, Gandhi JS, Wankhede SB. Development and validation of HPTLC method for simultaneous estimation of canagliflozin and metformin hydrochloride in bulk and tablet dosage form. S Afr Pharm J. 2017;84(6):65-71. doi: 10520/EJC-b3c016509.
Rank M, Kapupara P, Shah K. Development and validation of stability indicating HPTLC method for pioglitazone hydrochloride and metformin hydrochloride. Res J Pharm Technol. 2016;9(10):1555-61. doi: 10.5958/0974-360X.2016.00305.X.
Malgundkar SS, Mulla DS. Validated HPTLC method for simultaneous determination of metformin hydrochloride and glibenclamide in combined dosage form. IOSR J Pharm Biol Sci. 2014;9(2):54-9. doi: 10.9790/3008-09255459.
Bendale AR, Singh RP, Vidyasagar G. Development and validation of stability-indicating HPTLC method for determination of vildagliptin and metformin hydrochloride in pharmaceutical dosage forms. Int J Appl Pharm. 2018;10(1):36-45. doi: 10.22159/ijap.2018v10i1.20555.
Raja T, Lakshmana Rao A. Validated HPTLC method for simultaneous estimation of metformin hydrochloride and sitagliptin phosphate in bulk drug and pharmaceutical formulation. Int J Pharm Chem Biol Sci. 2012;2(4):696-702.
Thomas AB, Patil SD, Nanda RK, Kothapalli LP, Bhosle SS, Deshpande AD. Stability-indicating HPTLC method for simultaneous determination of nateglinide and metformin hydrochloride in pharmaceutical dosage form. Saudi Pharm J. 2011;19(4):221-31. doi: 10.1016/j.jsps.2011.06.005, PMID 23960763.
Dharmamoorthy G, Nandini Y, Anupama M, Sai Nandhini M, Susmitha JG, Reddy YK. Development and validation of stability-indicating HPTLC method for simultaneous estimation of metformin hydrochloride and pioglitazone in pharmaceutical dosage form. YMER. 2022;21(8):612-26.
Desai SA, Mardia RB, Suhagia BN, Desai HT. Development and validation of stability-indicating HPTLC method for simultaneous estimation of metformin, saxagliptin and dapagliflozin in combined matrix using AQbD. Bol Environ Pharmacol Life Sci. 2022;12(1):32-42.
Sen AK, Hinsu DN, Sen DB, Zanwar AS, Maheshwari RA, Chandrakar VR. Analytical method development and validation for simultaneous estimation of Teneligliptin hydrobromide hydrate and Metformin hydrochloride from it’s pharmaceutical dosage form by three different UV spectrophotometric methods. J Appl Pharm Sci. 2016;6(9):157-65. doi: 10.7324/JAPS.2016.60924.
Sen AK, Ghodasara S, Sen DB, Maheshwari RA, Zanwar AS, Dumpala RL. Evaluation of remogliflozin, vildagliptin, and metformin in tablet dosage form using modern and cost-effective UV spectroscopic methods. J Appl Pharm Sci. 2023;13(9):121-32. doi: 10.7324/JAPS.2023.136050.
Bhavyasri K, Surekha T, Sumakanth M. Novel method development and validation of dapagliflozin and metformin hydrochloride using simultaneous equation method by UV-visible spectroscopy in bulk and combined pharmaceutical formulation including forced degradation studies. J Pharm Sci Res. 2020;12(8):1100-5.
Sic Zlabur J, Bogdanovic S, Voca S, Skendrovic Babojelic M. Biological potential of fruit and leaves of strawberry tree (Arbutus unedo L.) from Croatia. Molecules. 2020;25(21):5102. doi: 10.3390/molecules25215102, PMID 33153090.
Munde MK, Kulkarni NS, Khiste RH, Sen DB. Development and validation of novel analytical method for empagliflozin and metformin hydrochloride in bulk and pharmaceutical dosage form by four different simultaneous estimation approaches using UV spectroscopy. Res J Pharm Technol. 2020;13(3):1236-42. doi: 10.5958/0974-360X.2020.00228.0.
Jayasundara UK, Herath HM, Kaushalya PV. Method development, validation and concentration determination of metformin hydrochloride and atorvastatin calcium using UV-visible spectrophotometry. J Anal Bioanal Tech. 2021;12:428. doi: 10.4172/2155-9872.1000428.
Cholke P, Shirsath M, Temak Y, Kagde A, Lagad R. Development and validation of UV-visible spectroscopy method for simultaneous estimation of saxagliptin hydrochloride and metformin hydrochloride in tablet dosage form. Int J Res Pharm Pharm Sci. 2018;3(4):31-4.
Majithia RH, Khodadiya DA, Patel VB. Spectrophotometric method development and validation for simultaneous estimation of anagliptin and metformin hcl by q – absorption ratio method in synthetic mixture. Heliyon. 2020;6(5):e03855. doi: 10.1016/j.heliyon.2020.e03855, PMID 32405546.
Prasanth VG, Eapen SC, Kutty SV, Rai A. Development and validation of UV spectroscopic methods for estimation of repaglinide and metformin hydrochloride in synthetic mixture. Int J PharmSci Health Care. 2012;2(2):150-8.
Sen AK, Pandey H, Maheshwari RA, Zanwar AS, Velmurugan R, Sen DB. Novel UV spectroscopic methods for simultaneous assessment of empagliflozin, linagliptin and metformin in ternary mixture. Indian J Pharm Educ Res. 2022;56(4s):s669-81. doi: 10.5530/ijper.56.4s.213.
Narikimalli A, Galla R. A stability indicating UPLC method development and validation for the simultaneous estimation of nateglinide and metformin hydrochloride in bulk and tablet dosage form. Future J Pharm Sci. 2023;9(1):55. doi: 10.1186/s43094-023-00503-2.
Fouad MM. RP-UPLC method development and validation for simultaneous estimation of vildagliptin with metformin hydrochloride and ciprofloxacin hydrochloride with eqdexamethasone sodium phosphate. World J PharmSci. 2015;3(7):1340-6.
Ahmed O, Ahmed MK, Rasheed A. Evaluation and validation of a UPLC method for simultaneous estimation of metformin and sitagliptin in oral dosage form. Eur J Pharm Med Res. 2019;6(12):365-71.
Malleswararao CS, Suryanarayana MV, Mukkanti K. Simultaneous determination of sitagliptin phosphate monohydrate and metformin hydrochloride in tablets by a validated UPLC method. Sci Pharm. 2012;80(1):139-52. doi: 10.3797/scipharm.1110-13, PMID 22396910.
Tammisetty MR, Challa BR, Puttagunta SB. A novel analytical method for the simultaneous estimation of remogliflozin and metformin hydrochloride by UPLC/PDA in bulk and formulation application to the estimation of product traces. Turk J Pharm Sci. 2021;18(3):296-305. doi: 10.4274/tjps.galenos.2020.39699, PMID 34157819.
Ahmed MK, Ahmed O, Rasheed A. Evaluation and validation of a UPLC method for simultaneous estimation of glimepiride, metformin and voglibose in oral dosage form. Eur J Biomed PharmSci. 2019;6(13):329-37.
Alshora D, Ibrahim MA, Sherif AY, Elzayat E, Alotaibi I. Optimization and validation of the UPLC method for rapid, facile, and simultaneous analysis of sitagliptin and metformin in quality control samples. ACS Omega. 2025;10(6):5829-37. doi: 10.1021/acsomega.4c09520, PMID 39989815.
Pawar AK, Unade TT. New stability-indicating UPLC method for determination of two antidiabetic drugs in combination: applications to bulk and tablet formulation. Int J Appl Pharm. 2022;14(4):192-9. doi: 10.22159/ijap.2022v14i4.44774.
Dinh CD, Thi Ngoc YN, Thanh DP. UPLC-MS/MS method for simultaneous determination of metformin and glimepiride in human plasma: a green approach. Rasayan J Chem. 2022;15(2):1525-33. doi: 10.31788/RJC.2022.1526368.
Gopal NM, Sridhar C. Validated stability-indicating ultra-performance liquid chromatographic method for simultaneous determination of metformin hydrochloride and empagliflozin in bulk drug and tablet dosage form. Int J Appl Pharm. 2017;9(3):45-50. doi: 10.22159/ijap.2017v9i3.17441.
Wang L, Shang K, Feng T, Dong W, Wang F, Shen X. LC-MS/MS assay for simultaneous determination of apixaban and metformin in rat plasma: assessment of pharmacokinetic drug-drug interaction. J Pharm Biomed Anal. 2022;213:115403. doi: 10.1016/j.jpba.2022.115403.
Kim NS, Yoo GJ, Kim KY, Lee JH, Park SK, Baek SY. Development and validation of an LC–MS/MS method for simultaneous analysis of 26 antidiabetic drugs in adulterated dietary supplements and its application to a forensic sample. J Chromatogr B. 2019:1114-5:1–12. doi: 10.1016/j.jchromb.2019.03.005.
Virumbrales-Munoz M, Livingston MK, Farooqui M, Skala MC, Beebe DJ, Ayuso JM. Development of a microfluidic array to study drug response in breast cancer. Molecules. 2019;24(23):4385. doi: 10.3390/molecules24234385, PMID 31801265.
Polagani SR, Pilli NR, Gajula R, Gandu V. Simultaneous determination of atorvastatin, metformin and glimepiride in human plasma by LC-MS/MS and its application to a human pharmacokinetic study. J Pharm Anal. 2012;3(1):9-19. doi: 10.1016/j.jpha.2012.09.002, PMID 29403791.
Ramisetti M, Atmakuri LR, Venkata BR, Adireddy V. Simultaneous determination of canagliflozin and metformin in human plasma by LC-MS/MS assay and its application to a human pharmacokinetic study. Indian J Pharm Educ Res. 2019;53(3s):s364-72. doi: 10.5530/ijper.53.3s.107.
Kalyan S, Parle A. Validated LC-MS/MS method for simultaneous estimation of dapagliflozin and metformin in pharmaceutical dosage form. IOSR J Pharm. 2020;10(11):31-8.
Kumar PP, Murthy TE, Basaveswara Rao MV. Development, validation of liquid chromatography-tandem mass spectrometry method for simultaneous determination of rosuvastatin and metformin in human plasma and its application to a pharmacokinetic study. J Adv Pharm Technol Res. 2015;6(3):118-24. doi: 10.4103/2231-4040.157982, PMID 26317076.
Prasad PB, Satyanarayana K, Mohan GK. Development and validation of LC-MS method for simultaneous estimation of antidiabetic drugs in combined dosage forms. Int J Pharm Sci Res. 2018;9(5):2001-8.
Mohamed D, Elshahed MS, Nasr T, Aboutaleb N, Zakaria O. Novel LC-MS/MS method for analysis of metformin and canagliflozin in human plasma: application to a pharmacokinetic study. BMC Chem. 2019;13(1):82. doi: 10.1186/s13065-019-0597-4, PMID 31384829.